
What 646 Traders Told Us About Prediction Markets After the 2026 Midterms

Prediction market participation held steady from the 2024 presidential election to the 2026 midterms, and so did trader confidence. That is the headline from an OpticOdds survey of 646 U.S. adults who placed a bet or trade through an online sportsbook or prediction market in the past 12 months, fielded in early November, right after the midterms.
As VP of OpticOdds, I read these results through the lens of the data behind the odds people follow and trade on. Here is what stood out and what it means.
Key Findings at a Glance
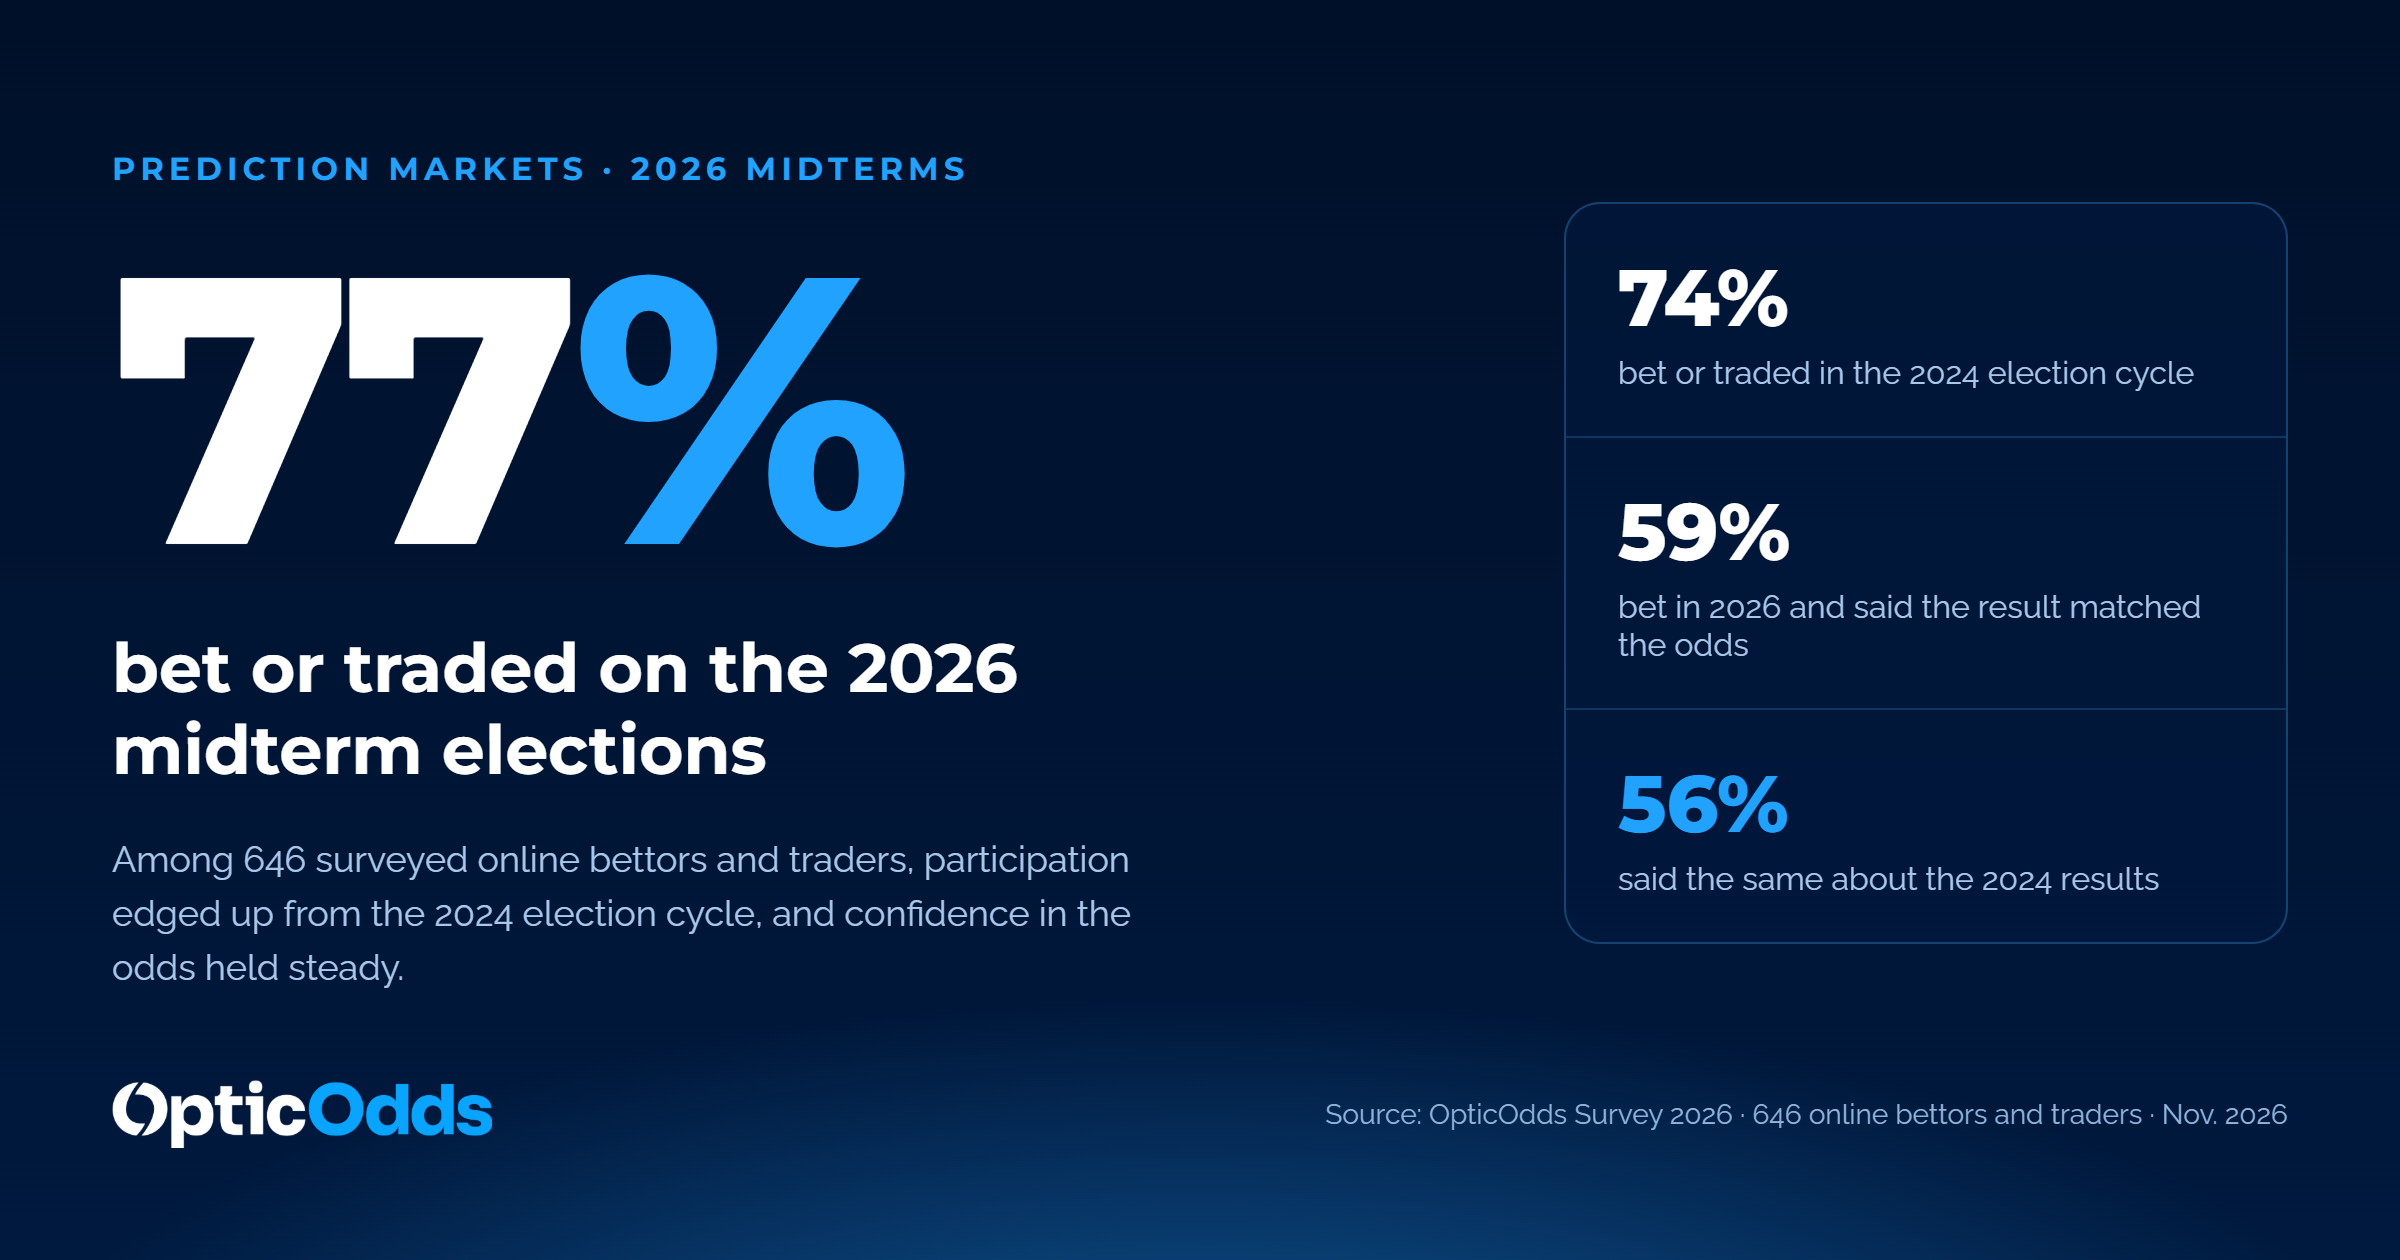
- 77% of respondents bet or traded on the 2026 midterms, compared with 74% for the 2024 election cycle.
- 59% traded the midterms and said the outcome matched what the odds suggested, up from 56% in 2024.
- 66% believe the prediction market odds they see in the news or on social media are the definitive or likely outcome.
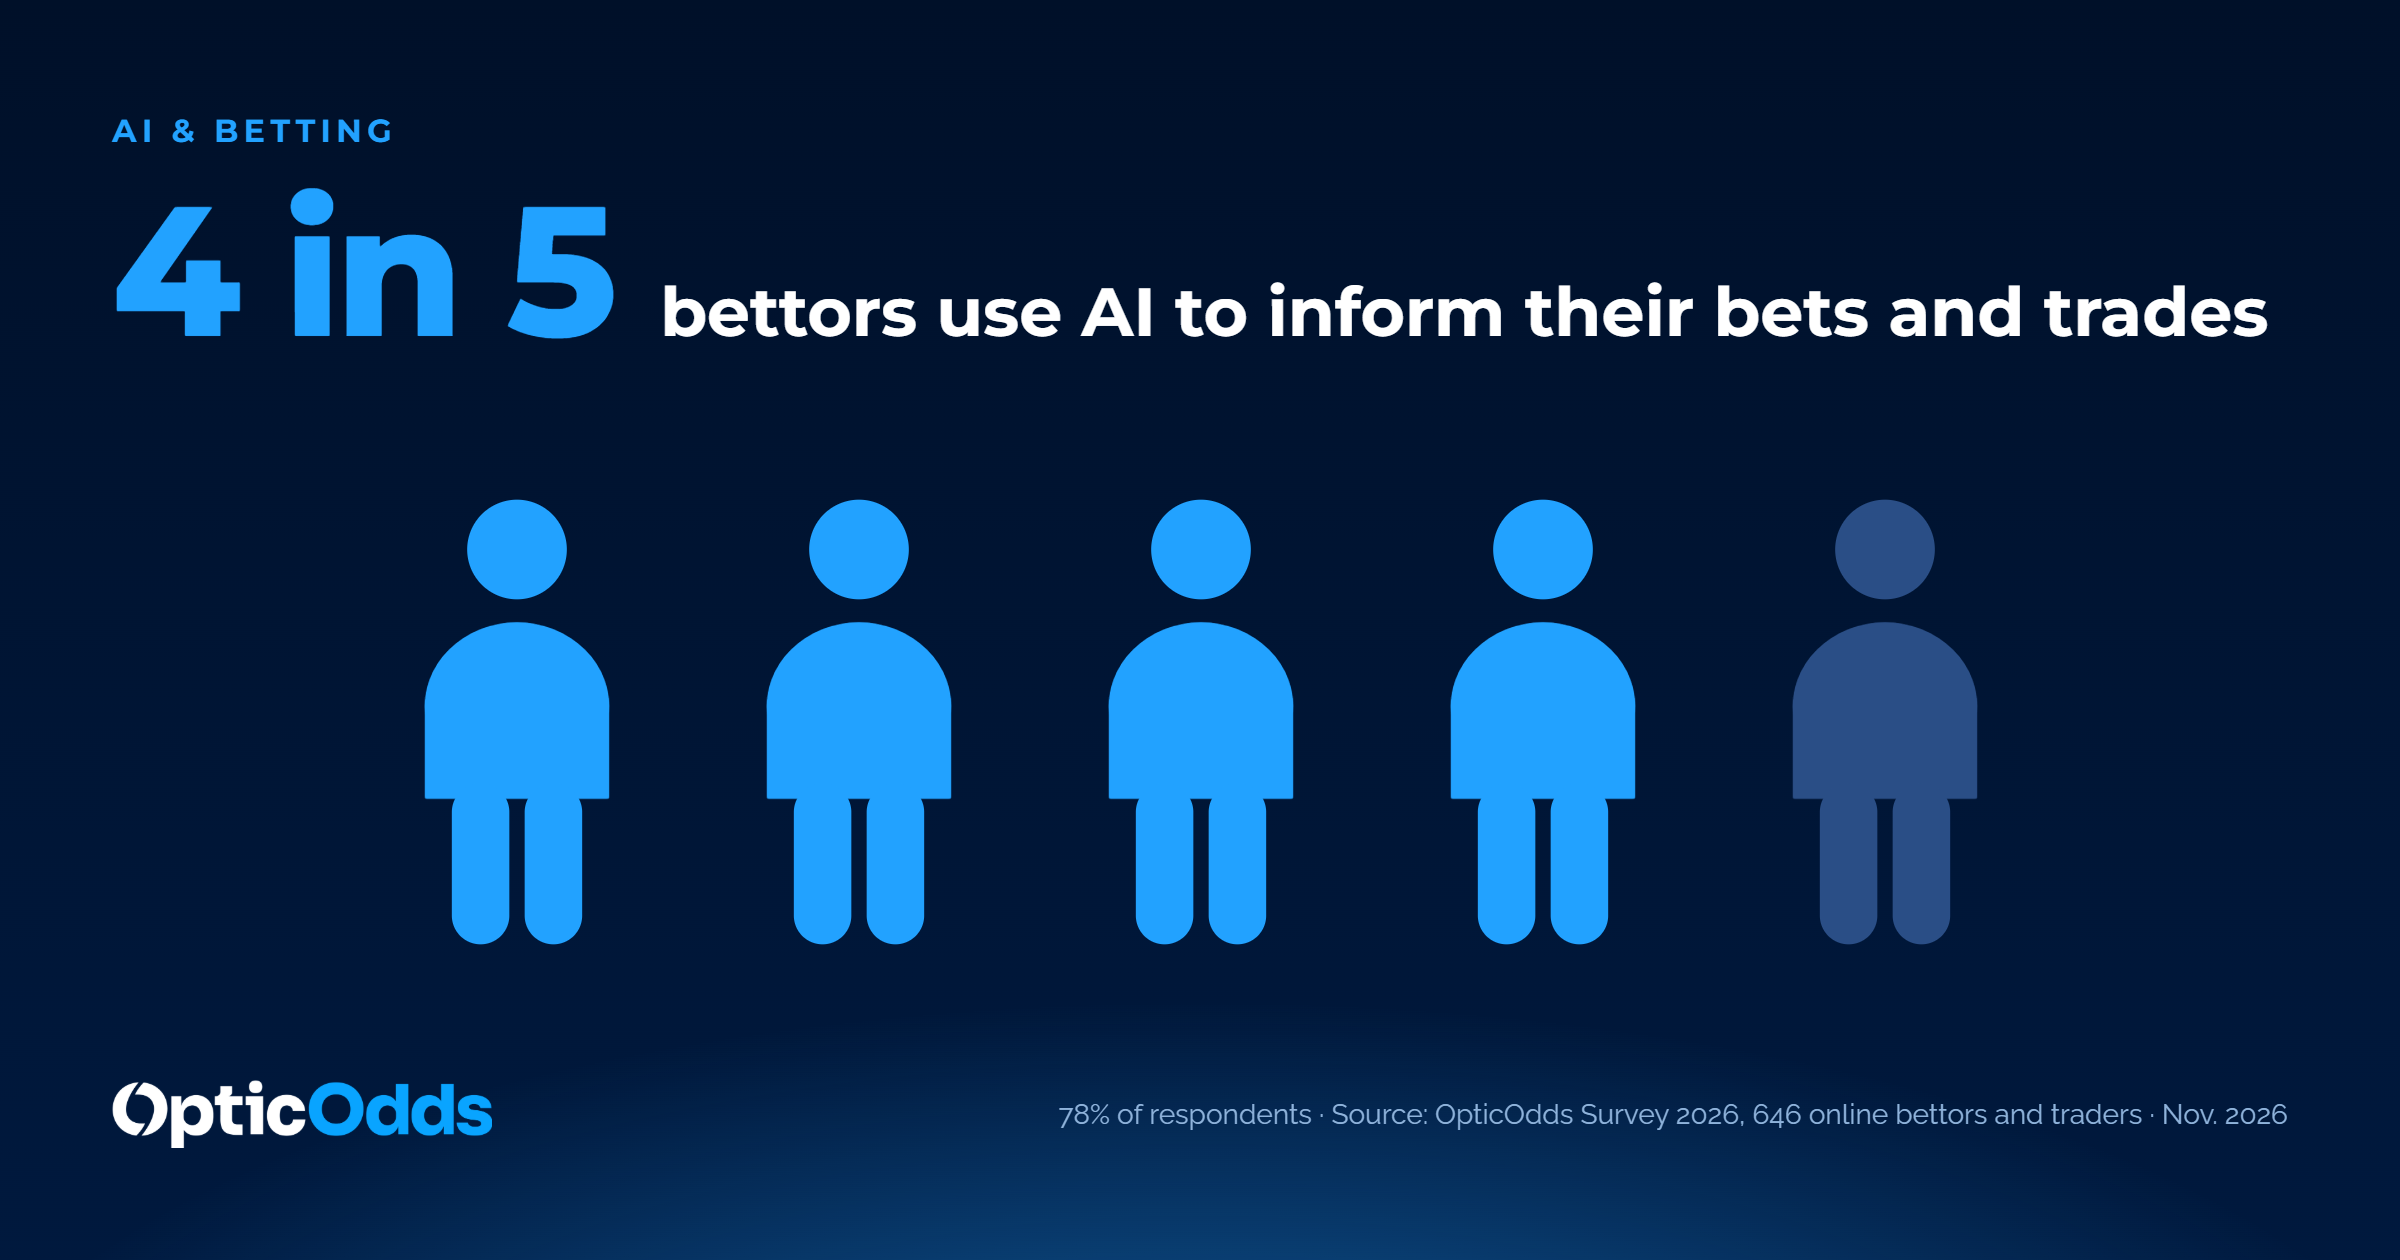
- 78% use AI to inform their bets or trades, and 59% say it has helped them.
- 93% plan to or may bet or trade on Super Bowl LXI, and 70% will do so regardless of which teams play.
- 54% primarily spend their winnings on household expenses such as groceries and utilities.
Prediction Market Participation Held Steady From 2024 to 2026
In the survey, 77% of respondents bet or traded on the 2026 midterm elections, compared with 74% who did so in the 2024 election cycle.
Both figures come from the same respondents, so the comparison reflects how they say they behaved in each cycle. Midterms generally draw less national attention than presidential years, yet participation among these respondents did not fall.
Confidence in Election Odds Barely Moved
Fifty-nine percent of respondents traded the 2026 midterms and said the outcome was what they expected based on the odds. That compares with 56% in 2024. The share who traded and said they were surprised by the outcome was 18% in both cycles.
The small gain in participation was matched by a similar gain in the share of traders who felt the results matched the odds. For the markets, consistent confidence across a presidential cycle and a midterm is a useful signal about how people judge what they see.
How Traders Read Prediction Market Odds
We asked what respondents believe when they see prediction market odds in news coverage or on social media. Forty percent said the reported odds are the definitive outcome, and 26% said they are the likely outcome. Another 18% said the odds simply reflect what traders are betting, and 8% said they indicate early results based on current data. Six percent ignore the odds, and 2% are not sure what they mean.

The answers differ by generation. Fifty-four percent of Gen Z respondents see reported odds as the definitive outcome, compared with 43% of Millennials, 33% of Gen X and 26% of Baby Boomers. Among Baby Boomers, 36% say the odds only show what traders are betting, compared with 22% of Gen X, 15% of Gen Z and 13% of Millennials.
A market price reflects what participants are willing to trade at a given moment. As odds appear in more news coverage and social feeds, how clearly they are explained matters for everyone who publishes or distributes them.
Sports Lead Every Category, and Elections Are the Top Non-Sports Draw
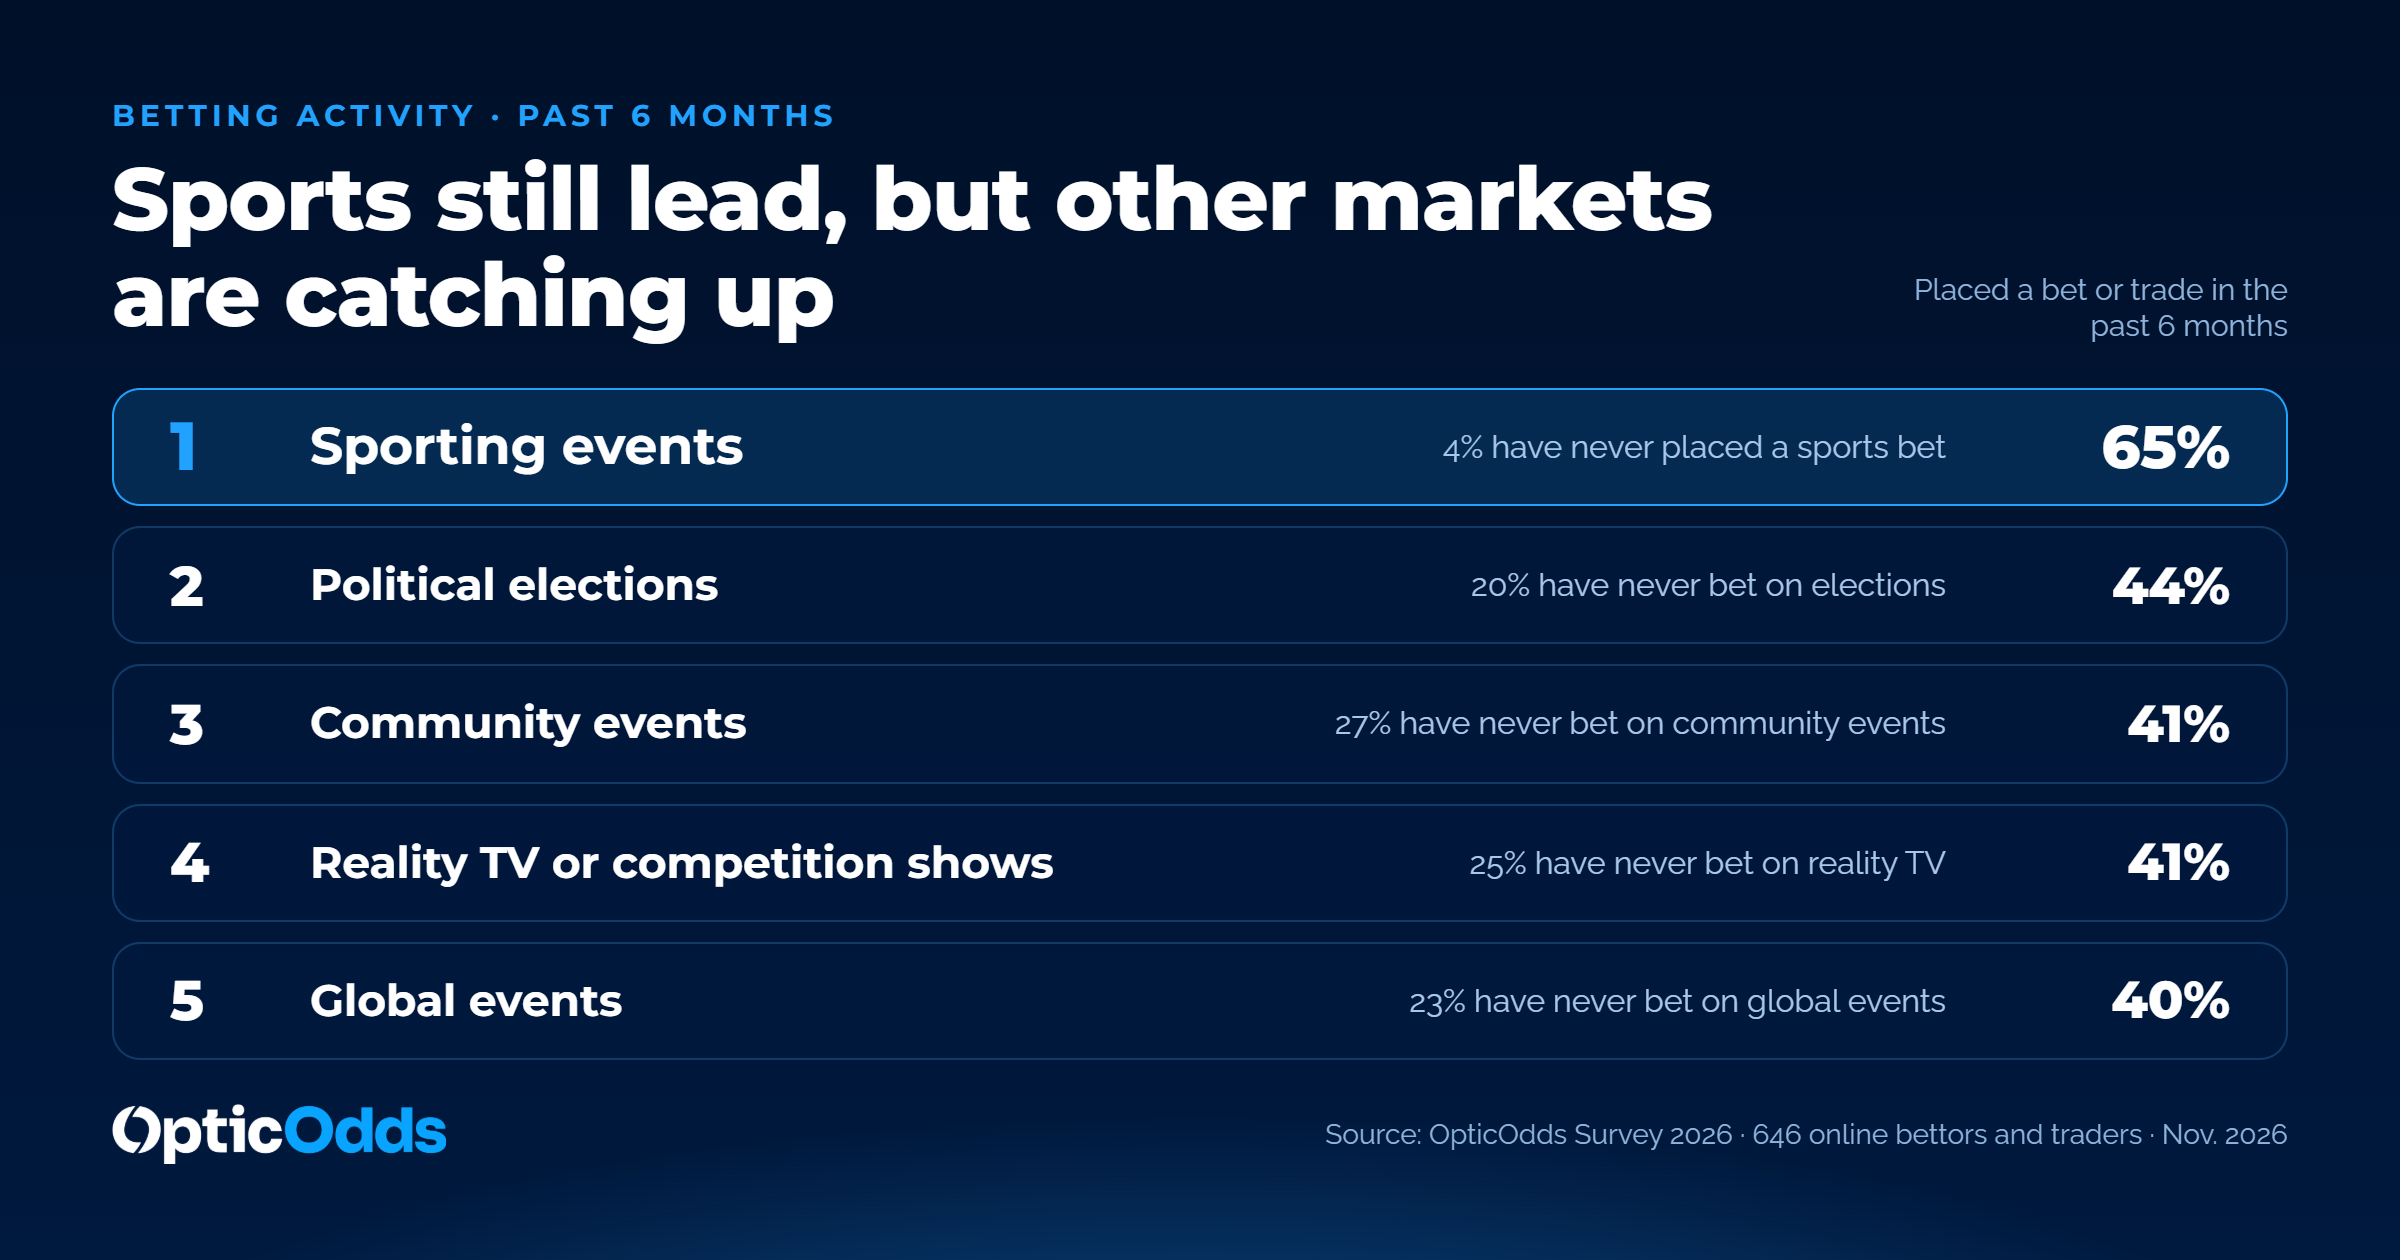
Sixty-five percent of respondents placed a sports bet or trade in the past six months. Political elections came next at 44%, followed by reality TV and community events at 41% each and global events at 40%.
The gap shows up again in the share who have never participated. Only 4% have never placed a sports bet or trade, compared with 20% for political elections, 23% for global events, 25% for reality TV and 27% for community events. Sports remain the anchor, and elections are the most active category outside of them.
Super Bowl LXI Participation Depends on the Matchup
Looking ahead, 93% of respondents said they plan to or may bet or trade on Super Bowl LXI (Super Bowl 61). Seventy percent will do so regardless of which teams are playing, and 23% will participate only if certain teams make it. Just 7% do not plan to take part, compared with 23% who did not trade the 2026 midterms.
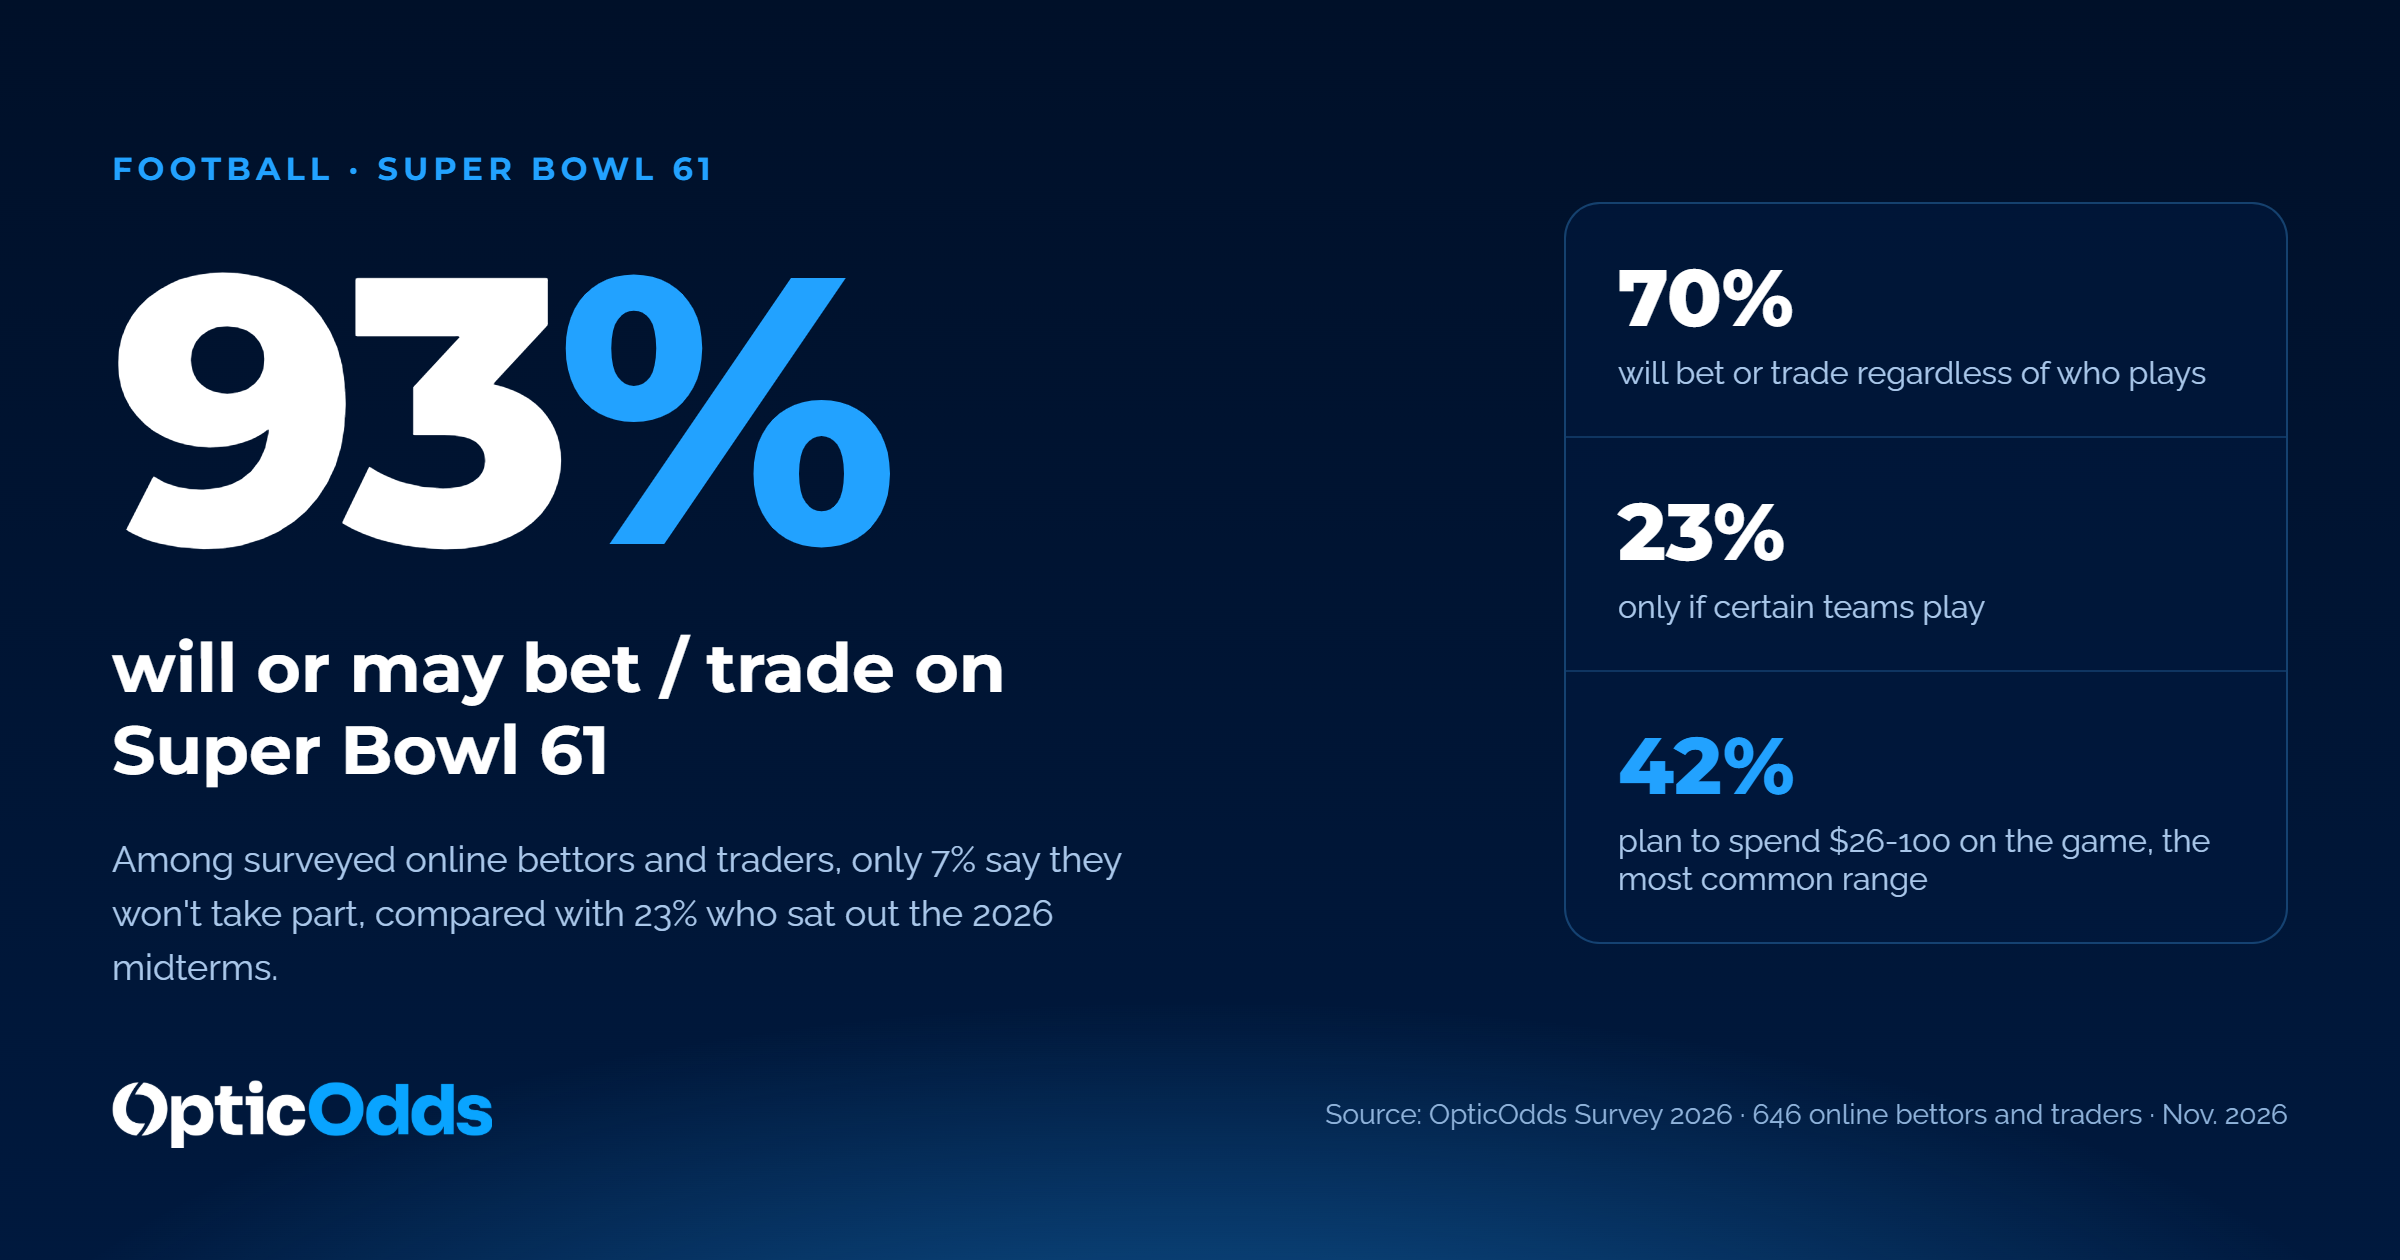
The firm commitment is not higher than midterm participation. The 70% who will participate regardless of the matchup sits below the 77% who traded the midterms, so the final number depends on who reaches the game.
Planned spending also skews a little higher. Forty-two percent plan to spend $26 to $100 on the Super Bowl and 37% plan to spend $101 to $500. For the midterms, 37% reported spending $26 to $100 and 33% reported $101 to $500.
AI Is Now Part of the Trading Workflow
Seventy-eight percent of respondents use AI to help inform their bets or trades. Fifty-nine percent say it has helped them, 16% say it has made no difference and 3% say it has had a negative impact. The other 22% do not use AI for this purpose.
Use varies by generation. Eighty-three percent of Millennials have used AI to inform their decisions, compared with 77% of Gen X, 76% of Gen Z and 52% of Baby Boomers. Perceived benefit rises as age falls: 68% of Gen Z respondents say AI has helped, compared with 62% of Millennials, 56% of Gen X and 36% of Baby Boomers.
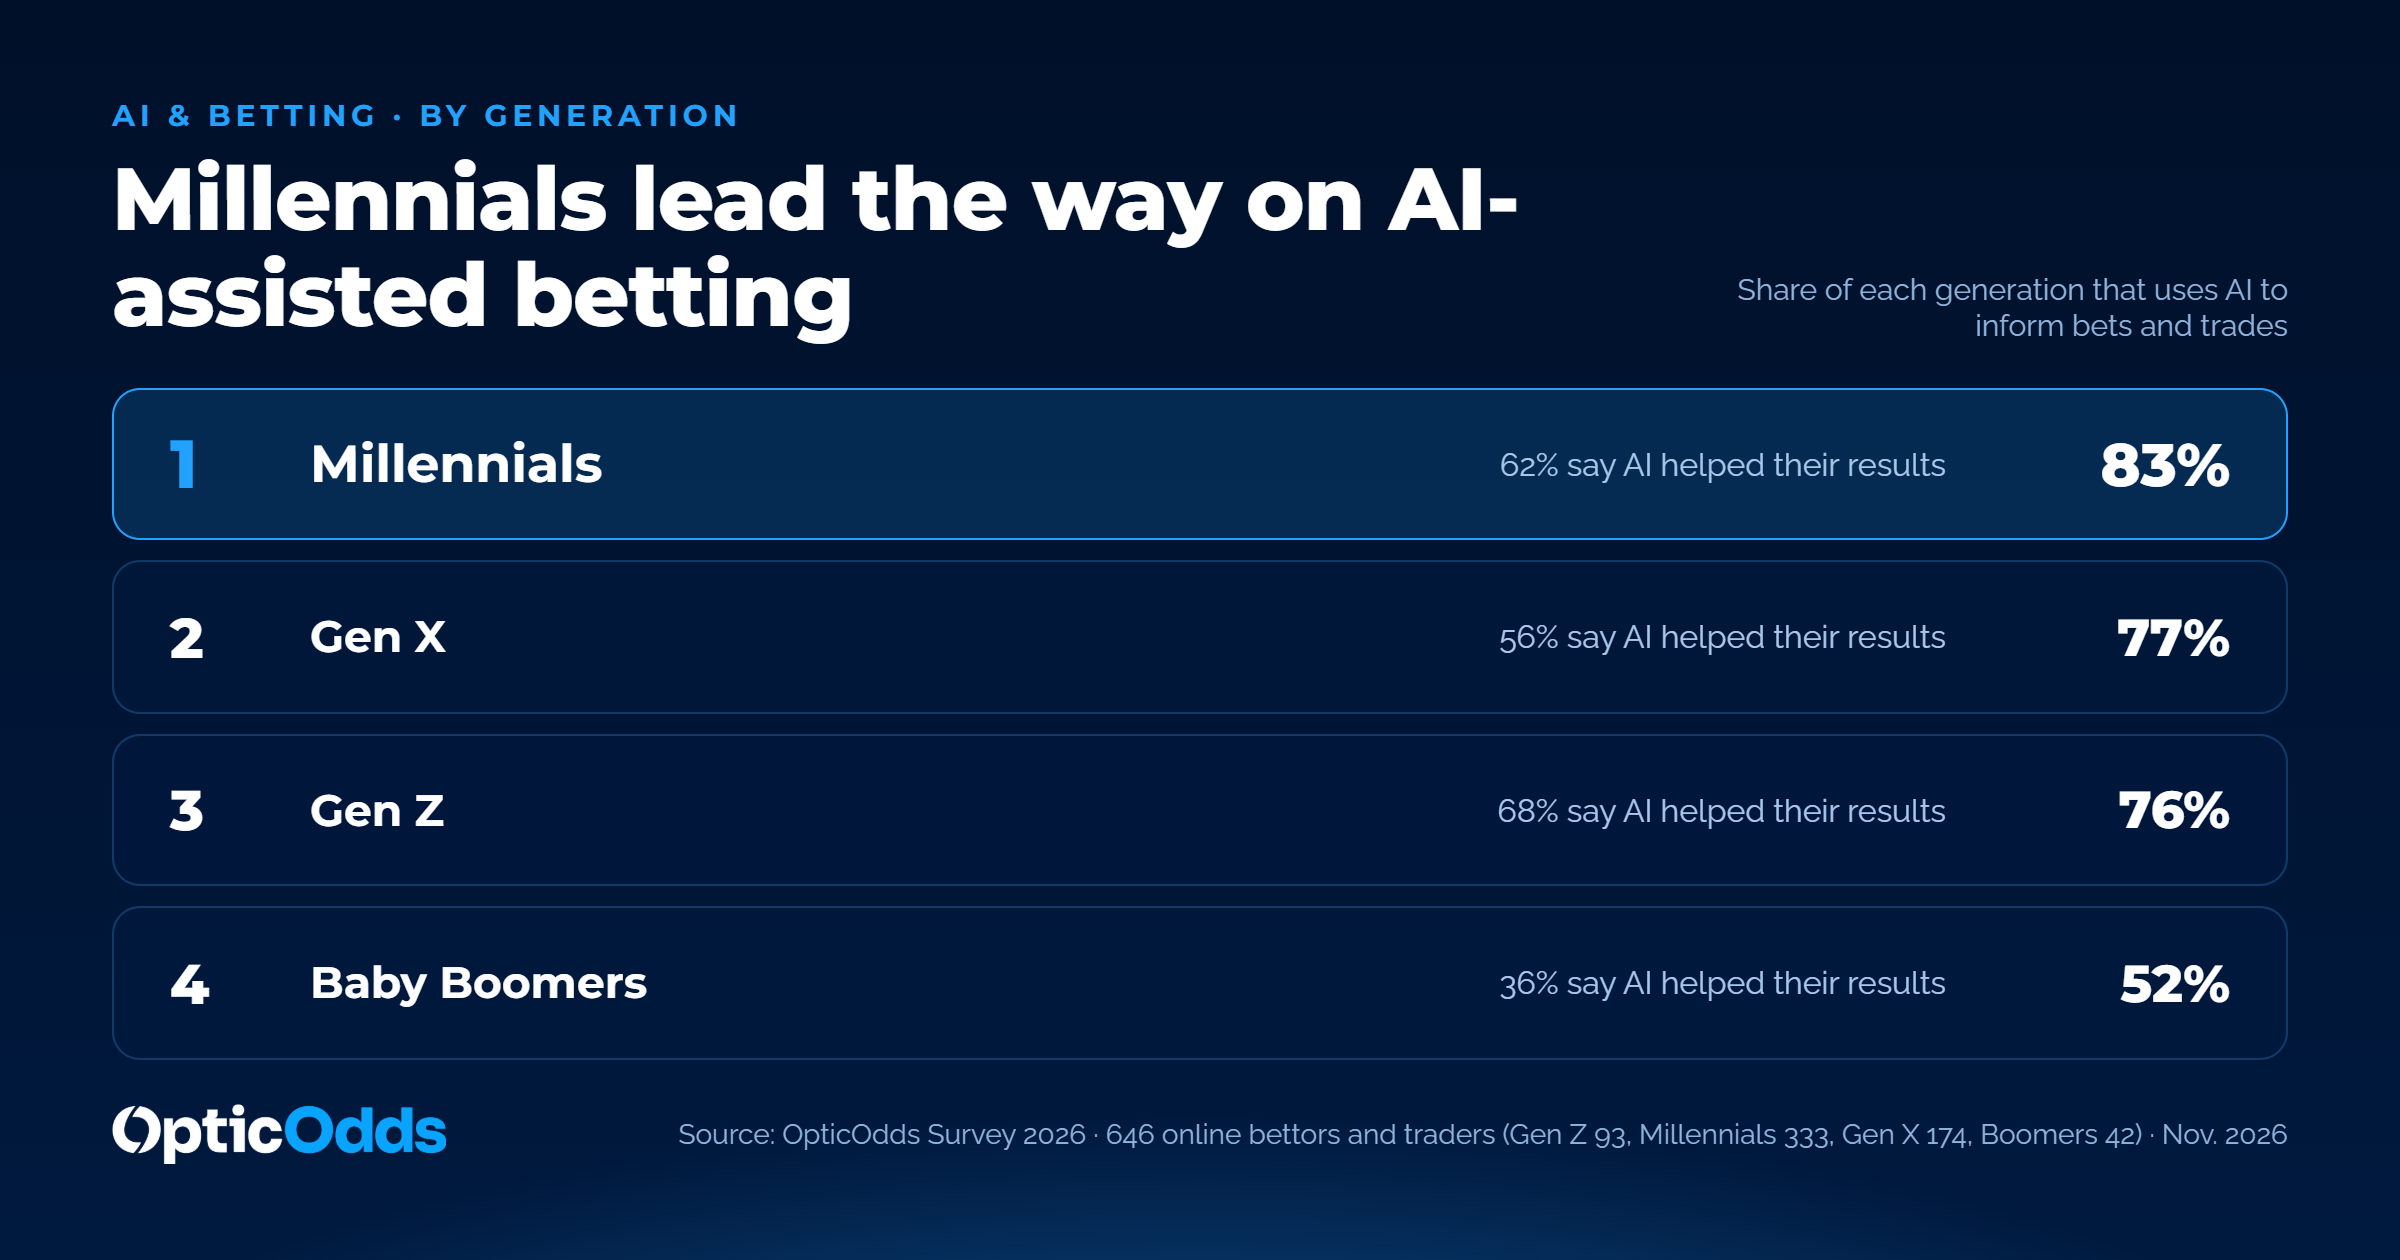
These are self-reported views, not measured results. They do show how widely AI tools have entered the process, with majorities in every generation using them and perceived benefit highest among the youngest traders.
How Traders Use Their Winnings Varies by Generation
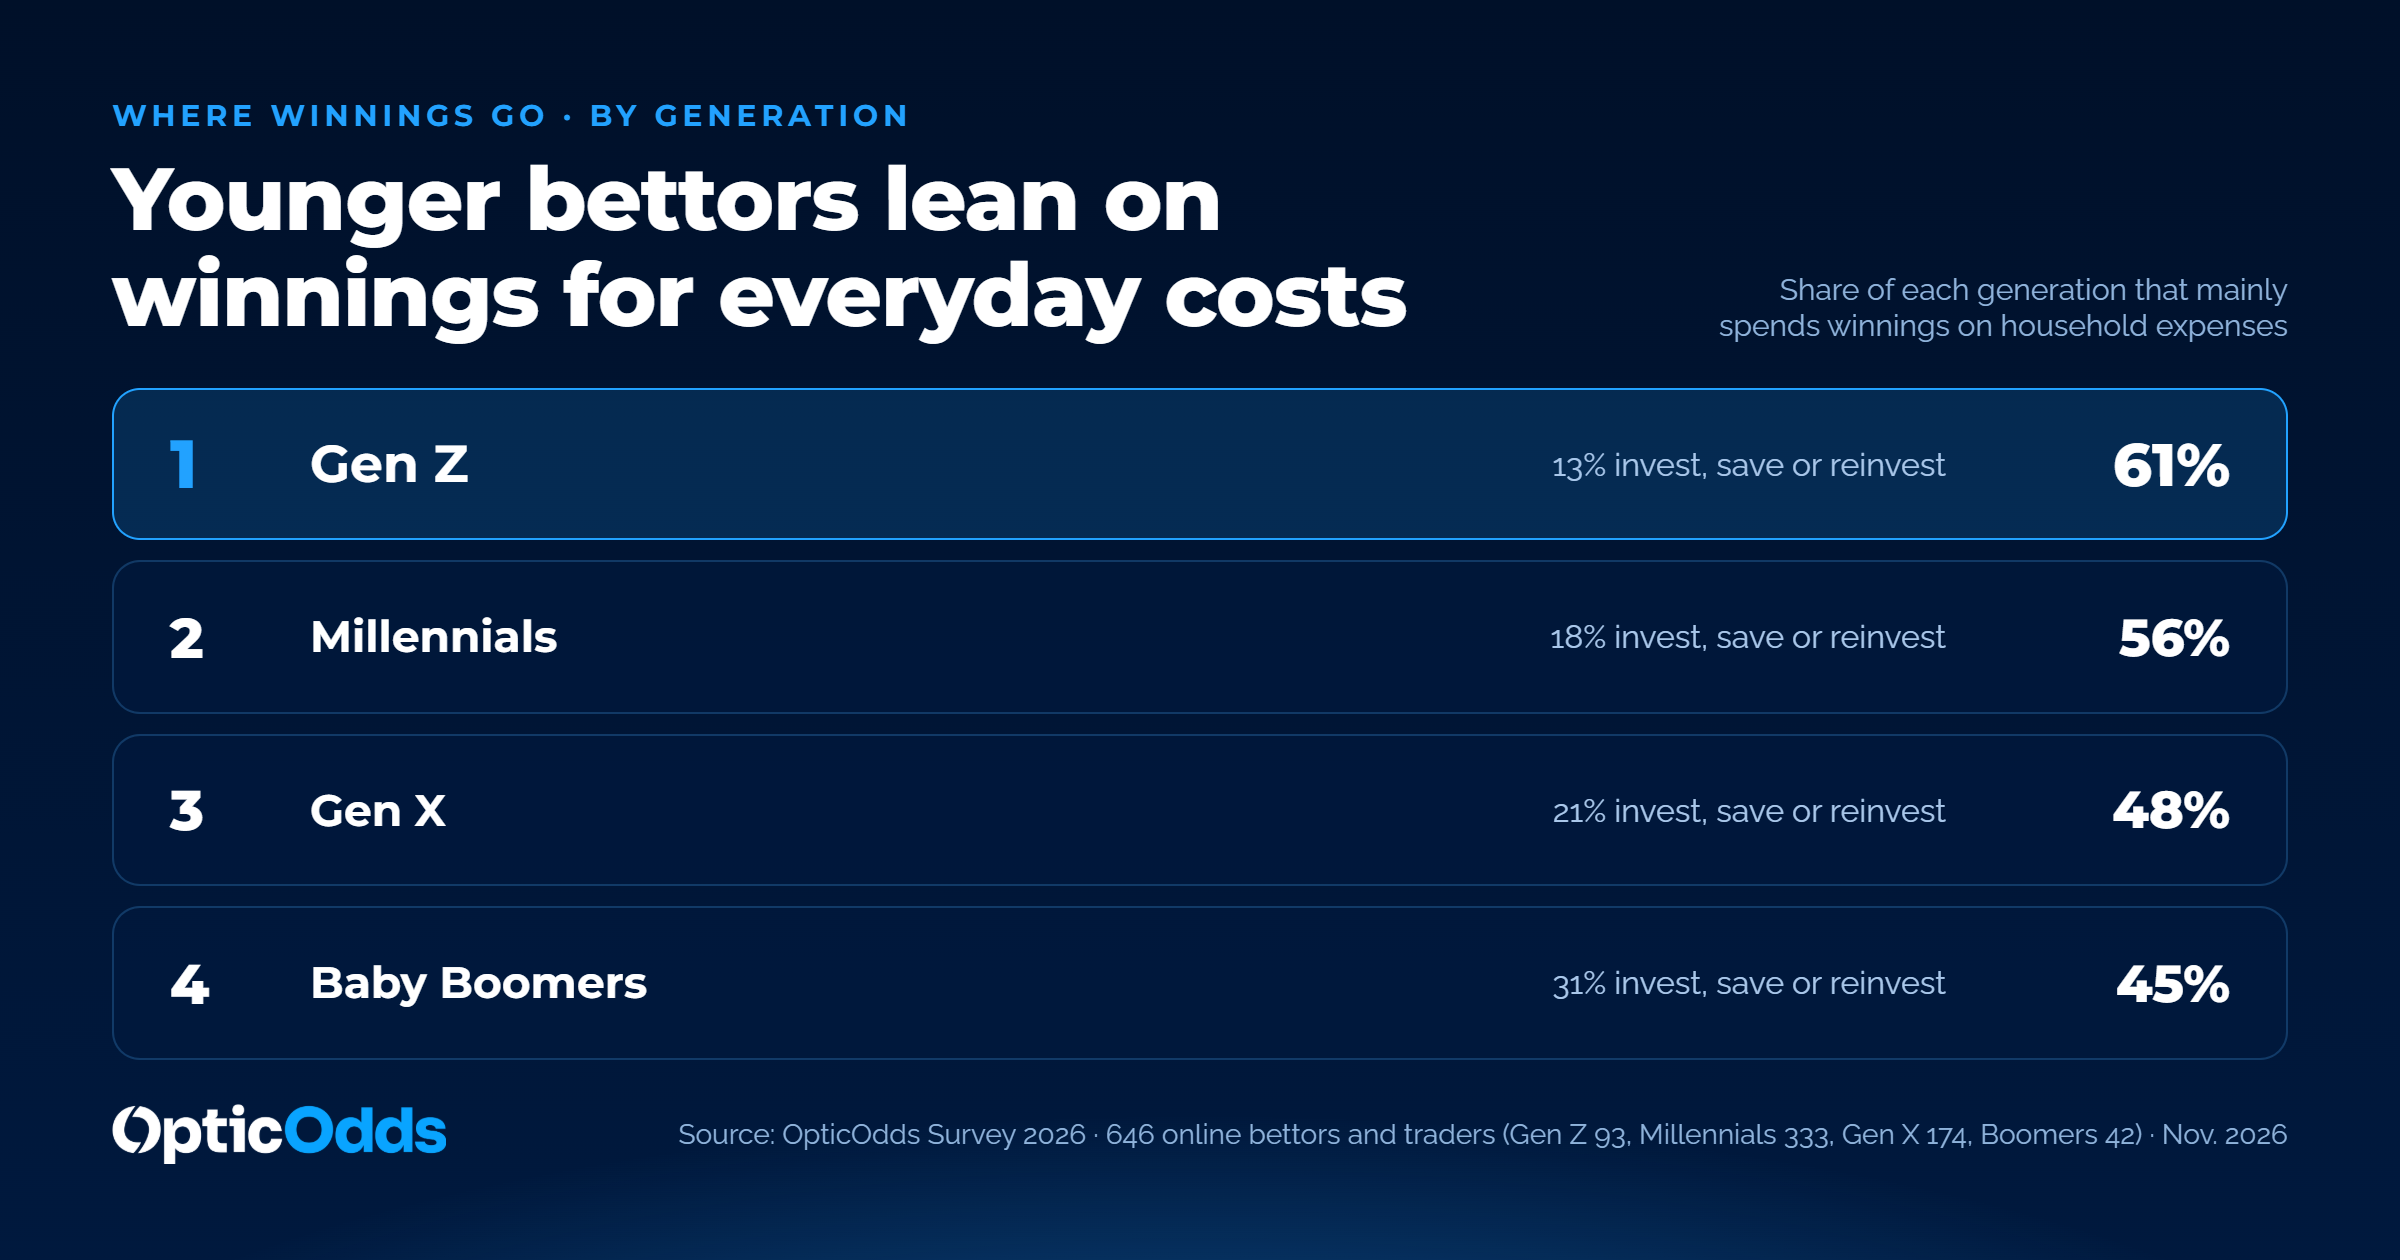
We asked how respondents primarily spend their winnings. Fifty-four percent said household expenses such as groceries, utilities and gas. Twenty-six percent said extracurriculars such as shopping, dining out and travel, 12% said savings or investments, and 8% said future bets or trades.
Household spending is the top choice in every generation and is highest among the youngest. It was the primary use for 61% of Gen Z respondents, 56% of Millennials, 48% of Gen X and 45% of Baby Boomers. Older generations are more likely to put winnings toward investments or future bets: 31% of Baby Boomers do so, compared with 21% of Gen X, 18% of Millennials and 13% of Gen Z.
What This Means for the Data Behind the Markets
Participation and confidence were consistent across two very different election cycles. That means steady demand for the odds people use to follow elections. Sports still anchor activity, and elections sit at the top of the categories around them.
Two-thirds of respondents treat reported odds as the definitive or likely outcome. When that many people read a number as a signal, the accuracy and timeliness of the data behind it carry real weight. That is true whether the market sits on a sportsbook or on a prediction market platform.
AI use is now common among traders, and younger traders are the most likely to say it has helped. AI tools draw on the data they can reach, so structured and reliable odds feeds matter more as those tools become part of the workflow. That is why OpticOdds works to make odds data available to AI platforms as well as to operators.
About the Survey
The OpticOdds 2026 survey asked 646 U.S. adults who placed at least one bet or trade through an online sportsbook or prediction market in the past 12 months about their activity, attitudes and spending. It was fielded in early November 2026, immediately after the midterm elections.
Results are self-reported, and 2024 figures reflect respondents' recall. Findings for Baby Boomers (42 respondents) and Gen Z (93 respondents) rest on small samples and are best read as directional. Percentages are rounded and may not sum to 100.
Ryan Weinstock is VP of OpticOdds. OpticOdds provides odds data to sportsbooks, prediction markets and other operators.


Power Your Platform with Real-Time Sports Betting Data


